

18 Oct Market Update: Third Quarter 2026
If you’ve been reading the financial headlines lately, you’ve probably noticed that everyone suddenly has an opinion about the bond market. (When was the last time bonds came up at a dinner party? Exactly.) Every quarter seems to have a theme, and this quarter’s theme was interest rates, so that’s where we’re going to spend most of our time today. Grab a cup of coffee, and let’s walk through what happened, why it’s happening, and what it might mean for you.
Headline Numbers
The Fed raised its target rate by a quarter point in late September, but honestly, that was just the opening act. The main show was in the bond market, where the yield on the 30-year Treasury jumped 68 basis points in three months and the 2-year jumped 72. If “basis points” makes your eyes glaze over, here’s your decoder ring: one basis point is one hundredth of a percent, so 68 basis points is 0.68%. That sounds like pocket change, but when it lands on a long-term bond, it leaves a mark.
Here’s why. Say you own a bond that pays 4%, and brand new bonds start paying 5%. Who in their right mind is going to pay you full price for your 4% bond? Nobody, that’s who! So the price of your bond drops until it’s a fair deal for the next buyer. Rates go up, bond prices go down. It’s a seesaw, every single time.
That seesaw tipped hard this quarter. Long-term Treasury bonds lost 9.0% in “total return,” which is the whole picture: the interest you collect plus any change in the bond’s price. Think of it like owning a rental house. The rent is your interest, what the house would sell for is your price change, and together they make your total return. The Bloomberg Aggregate Bond Index, basically the scorecard for the entire U.S. bond market (think of it as the Dow for bonds), lost 3.5%.2
Short-term bonds turned out to be the calmest corner of the room. The 2-year Treasury lost just 0.2% for the quarter and is still up 0.4% for the year, while the Aggregate index is down 2.9%. Here’s the rule of thumb: the longer a bond lasts, the harder it swings when rates move. A 30-year bond is a toddler on a sugar rush, and a 2-year bond is down for a nap.
Corporate bonds didn’t get a pass either. High-yield bonds, which come from companies on shakier financial ground and pay extra interest to make up for it, lost 2.0%. Investment grade bonds, the ones from sturdier companies, lost 5.2%.3
Over in the stock market, things looked surprisingly calm on the surface. The S&P 500 gained 2.3% for the quarter and is up 12.6% for the year, even with rates spiking and oil climbing from about $70 to over $90 a barrel. But peek under the hood and a few sectors took a beating. The Russell 2000, which tracks 2,000 smaller U.S. companies, fell 7.3%. Many of those companies don’t make money yet and borrow to keep the lights on, so when rates rise, they feel it first. (Picture a household living on a variable-rate credit card the month the rate jumps. Ouch.) REITs, which are companies that own buildings and collect rent, lost 6.2%, and utilities, your friendly power and water companies, dropped 12.7%.4 Both carry a lot of debt and pay steady dividends, so they tend to act like bonds when rates jump.
So what kept the S&P 500 afloat? The usual suspects: the mega cap tech giants and AI-related names. Those companies are sitting on so much cash that higher rates barely slow them down.
Wait, why are rates going up in the first place?
This is the question I’m hearing most in client meetings, and it’s trickier than you might think. Interest rates are shaped by three big things: how fast people expect the economy to grow, inflation, and creditworthiness (how likely the borrower is to pay you back).
The 10-year Treasury yield you hear about on the news is made of two ingredients. The first is the real yield, which is what lenders demand after inflation is taken out. The second is payment for the inflation they expect down the road. So if a bond pays 5% and prices rise 3%, your real yield is 2%, and that 2% is the part that actually grows your buying power.
Here’s the interesting part. The chart below shows that almost all of the recent jump in rates came from real yields, while inflation expectations barely budged. The analysts at MRB Partners chalk that up to the economy growing faster than anyone expected at the start of the year, both here and around the world.5 In plain English, rates aren’t rising because everyone is panicking about inflation. They’re rising because the economy is stronger than expected and lots of folks want to borrow.
The economy has been tougher than expected
I KNOW this one is a hard sell when you’re paying close to $9 a gallon for diesel here in California. But growth is coming in stronger than expected, and the economy is on pace to grow about 3% in the third quarter. Hiring has been on the soft side, but job openings, which tend to tell us where hiring is headed, are growing for the first time since 2022. Rates have also tracked nominal GDP, which is the size of the whole economy before we take out price increases. Over long stretches of history, rates tend to move right along with it, so you could almost argue rates are going up for the right reasons.9
All that AI spending has to be paid for somehow
You can’t open a newspaper without reading about AI, and building all those data centers takes an eye-watering amount of money. Goldman Sachs Research estimates about $7.6 trillion will go into AI computing, data centers, and the power to run them between 2026 and 2031. They also expect roughly a third of what the biggest players, the so-called hyperscalers, spend this year to be paid for by issuing debt (Wall Street speak for borrowing by selling bonds).10 That’s a whole lot of borrowing! I think we’re poised to see a boom in related services and businesses. Meanwhile, Uncle Sam is running a deficit, the gap between what the government spends and what it collects, of roughly $2 trillion a year.11 Remember Econ 101: interest rates are just the price of money, and when everybody wants to borrow at the same time, the price goes up.
The darker side: let’s talk about France
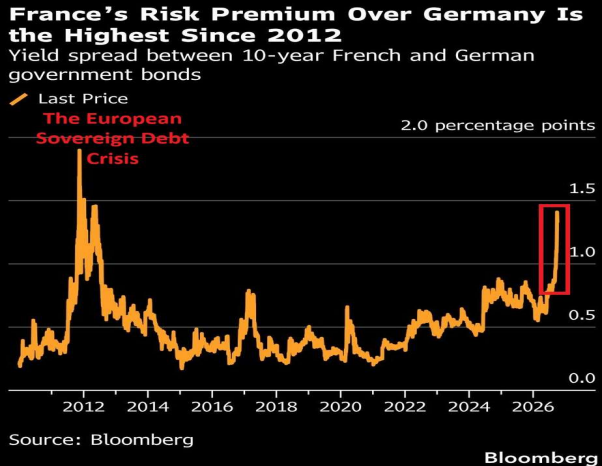
Not every rate spike is a healthy one. If you remember the European debt crisis in 2012, yields in places like Greece soared because investors stopped believing those countries could pay their bills.
Which brings us to France. This week, France’s 10-year government bond yield actually moved above Greece’s. (Yes, you read that right. Greece!) France’s risk premium over Germany, meaning the extra interest lenders demand to lend to France instead of Germany, is now the highest it’s been since the European debt crisis.12 The bond market is raising a very skeptical eyebrow.
So why is France an issue and not us, when both countries carry similar government debt? Because here in the U.S., households and companies have spent the last few years paying down their own debts, while in France, both the government and the private sector are stretched thin. Think of two neighbors with the same size mortgage: one paid off the credit cards and the car, and the other keeps refinancing the boat. France has no room for error, and with a big election coming in mid-April (one leading candidate even accused the head of the Bank of France of treason!)13, international investors aren’t exactly lining up to buy French bonds. To be clear, I’m not saying France is going to default. I’m saying the markets may force some hard choices on its leaders.
Do higher yields create opportunities?
Some investors look at a 5.6% yield on the 30-year Treasury and practically start drooling, and I get it. Not that long ago, that same yield was well under 2%!14 Close to $2 billion poured into one popular long-term Treasury ETF in just the first week of October, which was a record.
In my view, the better opportunity for many investors may be TIPS, short for Treasury Inflation-Protected Securities. With TIPS, you earn a base interest rate, and the government also bumps up your principal each year to keep pace with inflation. So if the base rate is 2% and inflation runs 3%, your total return should land somewhere around 5%. It’s a bond with a cost-of-living raise built right in!
Real yields on TIPS are at their highest levels in nearly 18 years.17 At the end of the third quarter, we moved the last of our intermediate bond holdings in client accounts into a short-term TIPS position. The reasons were trifold: First, locking in a yield above 2% after inflation is historically unusual. Second, it adds a hedge (think safety net) to your portfolio in case inflation runs hotter than it has in the past. And third, the short-term TIPS fund we chose should swing much less than longer-term bonds if rates keep climbing. That comes down to duration, which measures how much a bond’s price reacts when rates change, and short duration means less bounce.
Are higher yields bad for stocks?
Every year has its surprises, and 2026 has already thrown us at least two curveballs. First, if someone’s crystal ball had shown them the war with Iran on New Year’s Eve, they almost certainly would have sold some stocks, and they would have been wrong to do it. Second, stocks have held up remarkably well while interest rates shot higher all over the world.
But here’s the twist: stocks have actually gotten cheaper, even as their prices went up. How does that work? It comes down to the forward price-to-earnings ratio, or P/E, which tells you how many dollars investors are paying for every dollar of profit a company is expected to earn over the next year. A P/E of 19 means you’re paying $19 for $1 of profit. The S&P 500’s forward P/E has shrunk from roughly 23 to 19.18
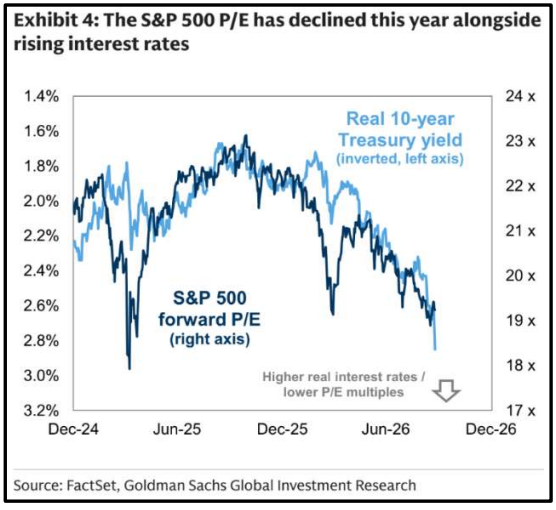
That’s exactly what the textbooks say should happen. When safe bonds pay more, future company profits look a little less shiny by comparison, so investors aren’t willing to pay as much for them. The higher the bar, the lower the price. We’ve seen the same thing happen with apartment buildings and private credit, where a lot of prices are lower than they were a year ago.
So why haven’t stocks fallen? Because company profits grew fast enough to more than make up for it. Goldman Sachs Research estimates nearly half of this year’s profit growth is tied to AI,19 and the skeptics say the AI boom can’t last. Over three to five years, they may well be right! But we’re not seeing signs of the cycle ending yet, and at the end of the day, a dollar of earnings is a dollar of earnings, no matter which industry it comes from.
History gives us an interesting comparison. Between October 1998 and January 2000, the 10-year Treasury yield climbed from about 4.3% to nearly 6.8%20, and the economy kept humming because growth was strong and demand for borrowing was booming. Stocks did just fine through that stretch. Now, I’m not going to pretend that story ended happily ever after (we all remember what happened to tech stocks shortly after!), but the lesson still holds: rising rates and rising stocks can happen together when strong growth is doing the heavy lifting.
The bottom line
Rates can climb for good reasons and for bad ones. Right now, the U.S. is in the good camp, where a strong economy and lots of demand for borrowing are pushing rates up. France is in the other camp, where debt and politics are doing the pushing, and when that happens, the bond market gets the final say. You may hear some talking heads on social media say the same thing is happening here in the U.S. Our rate climb looks similar on the surface, but the reasons behind it are very different. That nuance is important!
How long this lasts is anyone’s guess. If inflation heats back up and the Fed has to raise rates aggressively to cool things off (what the Fed calls “tightening”), that could be what ends the party. And if France or another debt-heavy “weak link” economy hits a rough patch, we could see more bumps across every market, with a little extra noise from our midterms on top. But for now, I don’t expect rising rates around the world to derail the economy in any serious way.
As always, staying diversified and focused on the fundamentals is what carries portfolios through times like these. Please give us a call if you would like to talk about the current markets and what they mean for your portfolio.
Sources and Notes
1. Federal Reserve, FOMC statement, September 16, 2026 (target range raised to 3.75%-4.00%). Treasury yields: U.S. Department of the Treasury, Daily Treasury Par Yield Curve Rates, 6/30/2026 (2-year 4.14%, 30-year 4.91%) and 9/30/2026 (2-year 4.88%, 30-year 5.64%).
2. Total returns for the Bloomberg U.S. Long Treasury Index and the Bloomberg U.S. Aggregate Bond Index, third quarter 2026: Bloomberg index data.
3. Total returns for 2-year Treasuries, the Bloomberg U.S. Corporate High Yield Index, and the Bloomberg U.S. Corporate (investment grade) Index, third quarter and year to date through 9/30/2026: Bloomberg index data.
4. Index returns, third quarter 2026: S&P Dow Jones Indices (S&P 500 and sector indexes) and FTSE Russell (Russell 2000), via Bloomberg. Crude oil: U.S. Energy Information Administration, West Texas Intermediate spot price.
5. MRB Partners, “Real Yields Driving Bond Yields Up” (Chart 7), 2026, using Bloomberg data. Real yield shown as the nominal yield minus the CPI swap rate.
6. U.S. Energy Information Administration, Gasoline and Diesel Fuel Update: California average retail diesel price of $7.76 per gallon on September 9, 2026 (AAA reported $7.87 the same day). $9.999 station prices: GasBuddy, as reported by KMPH/Sinclair, September 10, 2026.
7. Federal Reserve Bank of Atlanta, GDPNow model estimate of 3.6% annualized real GDP growth for the third quarter of 2026, October 8, 2026.
8. U.S. Bureau of Labor Statistics, Job Openings and Labor Turnover Survey, September 29, 2026 release: 7.08 million job openings in August 2026, compared with 6.92 million in August 2025.
9. Nominal GDP: U.S. Bureau of Economic Analysis, National Income and Product Accounts. 10-year Treasury yield: Federal Reserve Board, H.15 Selected Interest Rates.
10. Goldman Sachs Research, “Tracking Trillions: The Assumptions Shaping the Scale of the AI Build-Out,” May 1, 2026; Goldman Sachs Exchanges, “How AI Debt Is Reshaping Credit Markets,” August 5, 2026.
11. Congressional Budget Office, Monthly Budget Review, October 2026, as summarized by the Committee for a Responsible Federal Budget, October 8, 2026 (fiscal year 2026 deficit of $2.0 trillion).
12. France-Germany 10-year government bond spread: Bloomberg (chart above). France’s spread moving above Greece’s: Tech Times, “France Bond Yields Top Italy and Greece as ECB Crisis Rescue Tool Is Blocked,” October 5, 2026.
13. Election dates (April 18 and May 2, 2027): Public Sénat. Jean-Luc Mélenchon’s accusation against Banque de France Governor Emmanuel Moulin: MoneyVox, October 7, 2026, following the Governor’s interview with the Financial Times.
14. U.S. Department of the Treasury, Daily Treasury Par Yield Curve Rates, 9/30/2026 (30-year 5.64%). Historical 30-year yields below 2% (2020): Federal Reserve Bank of St. Louis, FRED, series DGS30.
15. etf.com, “ETF Inflows Top $41B as Investors Pile Into Brazil, Long Bonds,” October 12, 2026 (iShares 20+ Year Treasury Bond ETF). The fund is named only to identify the data and is not a recommendation.
16. Hypothetical example for illustration only. It does not represent any actual investment or account and does not reflect fees, expenses, or taxes. Actual TIPS returns will vary. Inflation adjustments to TIPS principal are generally taxable in the year they occur, even though they are not paid out until the bond matures or is sold.
17. U.S. Department of the Treasury, Daily Treasury Par Real Yield Curve Rates, October 13, 2026 (10-year 2.88%). The September 17, 2026 10-year TIPS auction priced at a 2.653% real yield, the highest in nearly 18 years: TIPSWatch, September 17, 2026, based on Treasury auction results.
18. FactSet, Earnings Insight, October 9, 2026 (S&P 500 forward 12-month P/E of 19.1). Chart: FactSet and Goldman Sachs Global Investment Research.
19. Goldman Sachs Research, “Can AI Investment Drive S&P 500 Earnings Even Higher?” September 23, 2026.
20. 10-year Treasury yield, October 1998 through January 2000: Federal Reserve Board, H.15 Selected Interest Rates; Federal Reserve Bank of St. Louis, FRED, series DGS10.
Indexes are unmanaged and cannot be invested in directly. Index returns do not reflect fees or expenses. Past performance is not indicative of future results.
Information is provided for informational purposes only and should not be relied upon in any manner as professional advice, or an endorsement of any practices, products, or services. There can be no guarantees or assurances that the views expressed here will be applicable for any particular facts or circumstances and should not be relied upon in any manner. You should consult your own advisers as to legal, business, tax, and other related matters concerning any investment.
The commentary in this post (including any related blog, podcasts, videos, and social media) reflects the personal opinions, viewpoints, and analyses of Angela Wright, an Investment Adviser Representative of Gemmer Asset Management LLC (“GAM”) and should not be regarded as the views of GAM, or a description of advisory services provided by GAM or performance returns of any GAM client. References to securities or market-related performance data are for illustrative purposes only and do not constitute an investment recommendation or offer to provide investment advisory services. Charts and graphs provided within are for informational purposes solely and should not be relied upon when making any investment decision. Past performance is not indicative of future results. The content speaks only as of the date indicated. Any projections, estimates, forecasts, targets, prospects, and/or opinions expressed in these materials are subject to change without notice and may differ or be contrary to opinions expressed by others.
This material is provided for informational and educational purposes only and is not intended as investment, tax, legal, or accounting advice or as a recommendation to buy or sell any security. The examples and illustrations presented are hypothetical and are intended solely to demonstrate financial planning concepts. They do not represent the performance of any actual client account, and actual results will vary. Investing involves risk, including the possible loss of principal. Past performance is not indicative of future results. There is no guarantee that any investment strategy, including maintaining cash reserves or fixed-income allocations, will be successful or achieve its intended objective. Investment recommendations should be based on an individual’s objectives, financial situation, and risk tolerance.